My new toy: April 1 syslog-ng performance tests
Almost 15 years ago, Balabit had a campaign, stating that syslog-ng could process 650k messages a second. Now I am happy to present 7 million EPS (events per second). Timing the announcement to April 1 is not a coincidence :-)
While the 650k EPS measurement was true, it was misleading. This value was measured right after syslog-ng 3.2 introduced multi-threading, in lab environment, under optimal circumstances, using synthetic log messages. However, there was no fine print explaining this, just the statement that syslog-ng could process 650k EPS. It was fixed after a while, but it took years to recover from the effects of this marketing campaign, and engineers ten years later still had a nervous breakdown when someone mentioned “650k”. Why? Because from that moment, everyone expected syslog-ng to collect logs at that message rate in a production environment with complex configurations. Which was of course not the case.
Fast-forward to today, I’m happy to share that:
syslog-ng can collect logs at 7 million EPS
-
Is this measurement value valid? Yes.
-
Does it apply to real world? No.
-
Does it sound good? Definitely :-)
My latest syslog-ng benchmark results
The tool: sngbench
I love playing with various non-x86 systems. I have various ARM, POWER, MIPS systems at home, and sometimes I access other architectures, like RISC-V remotely. And, of course, not just different architectures, but different operating systems: various Linux distributions, MacOS, FreeBSD, sometimes also other BSD variants. I’m a server guy, and for the past 15+ years: a syslog-ng guy. Sometimes I had access to an exotic system on the other side of the world only for less than an hour, but I almost always tested syslog-ng.
For many years I had a bunch of shell scripts and configs to benchmark syslog-ng performance. Not for real world production loads, but rather for comparing architectures and operating systems. I needed a script which could do measurements with minimal dependencies and do it quickly, in one go. This is how sngbench was born, based on my previous ugly scripts. It has quite a few advantages and shortcomings:
-
Minimal dependencies: bash and syslog-ng
-
No complex setup: everything runs on the same host
-
network bandwidth is not a limiting factor
-
loggenandsyslog-ngprocesses are competing for resources -
Two bundled configurations: a performance tuned and the default syslog-ng.conf from openSUSE with minimal modifications to add a TCP source
-
By default, very short (20 seconds) measurements, so disk I/O is not a limiting factor
-
Many different test scenarios: from a single TCP connection to 4 * 128
Of course this describes just the “factory defaults”. You can easily change the test scenarios and configurations too.
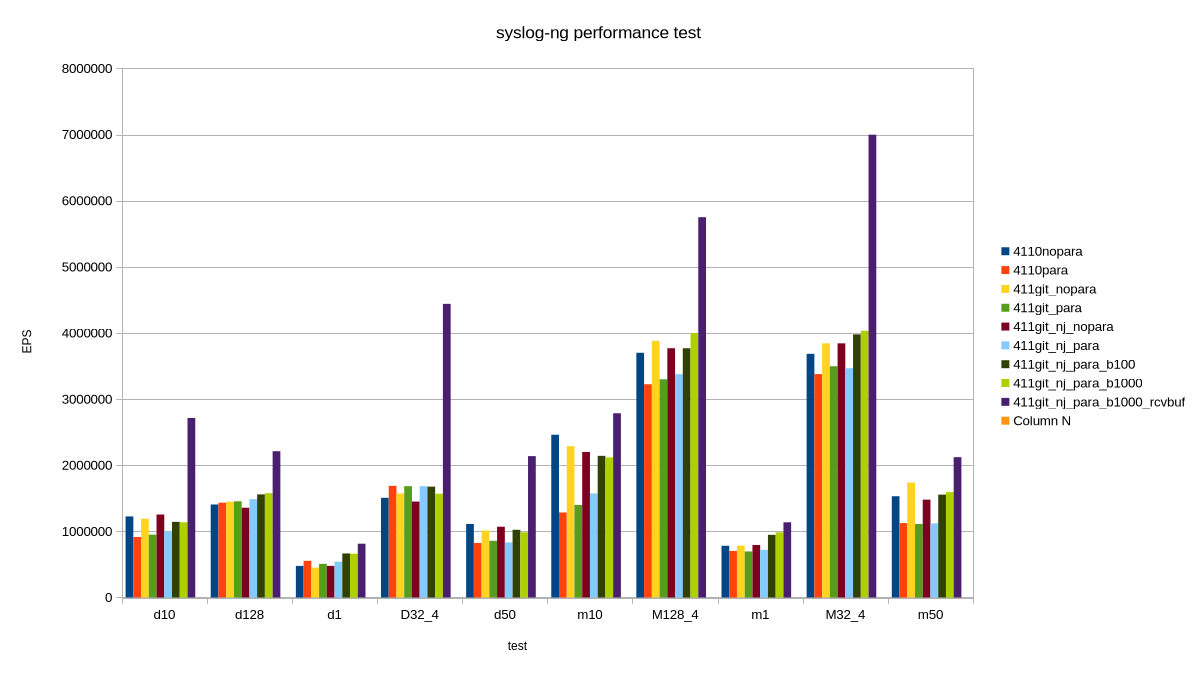
How I reached 7 million EPS, and why it is not relevant
I was testing syslog-ng code which was not yet even merged to the development branch. First, I tested these patches with various settings. Along the way I remembered that Splunk guidelines mention so-rcvbuf tuning also for TCP connections. Previously I only used that for optimizing UDP performance. Now I have done it for TCP. Wonders happened :-)
But, of course, the main question is: can you achieve this performance in production? TL;DR: No.
My tests are run from localhost. Network bandwidth is not an issue. Tests are run in short bursts. This is peak performance; when it comes to writing logs to files or forwarding to a cluster of Splunk or Elasticsearch endpoints around the clock, that would be slower. Also, in my fastest test case, logs came from four different loggen instances, over 32 TCP connections each, at a constant rate. In the real world, logs come in bursts and connections are opened and closed regularly.
Test environment and tests
I used my AI mini workstation with Fedora Linux 44 Beta. First, I took a base line with stock syslog-ng 4.11.0 included in the distribution. Then I used my syslog-ng git snapshot packages for Fedora from https://copr.fedorainfracloud.org/coprs/czanik/syslog-ng-githead/. Initially it also had jemalloc support compiled in. Later I disabled it and purely focused on the yet to be merged parallelize() optimizations from GitHub. I experimented with enabling and disabling parallelize(), adding various batch_size() values, and finally also so-recbuf().

AI in a miniature box :-)
This blog is part of a longer series about my adventures with my new machine and AI. You can reach me to discuss this blog on one of the contacts listed in the upper right corner. You can read the rest of the blogs under the toy tag.